PORTFOLIO RISK ANALYTICS
A quant notebook that runs AMZN's 29-year return series through the full risk battery against SPY — Sharpe and Sortino, drawdown curves, beta and alpha, a monthly-return heatmap and a 1,000-path Monte Carlo on the trailing year. A 30% CAGR reads very differently once you plot the drawdown underneath it.
SOURCE ON GITHUB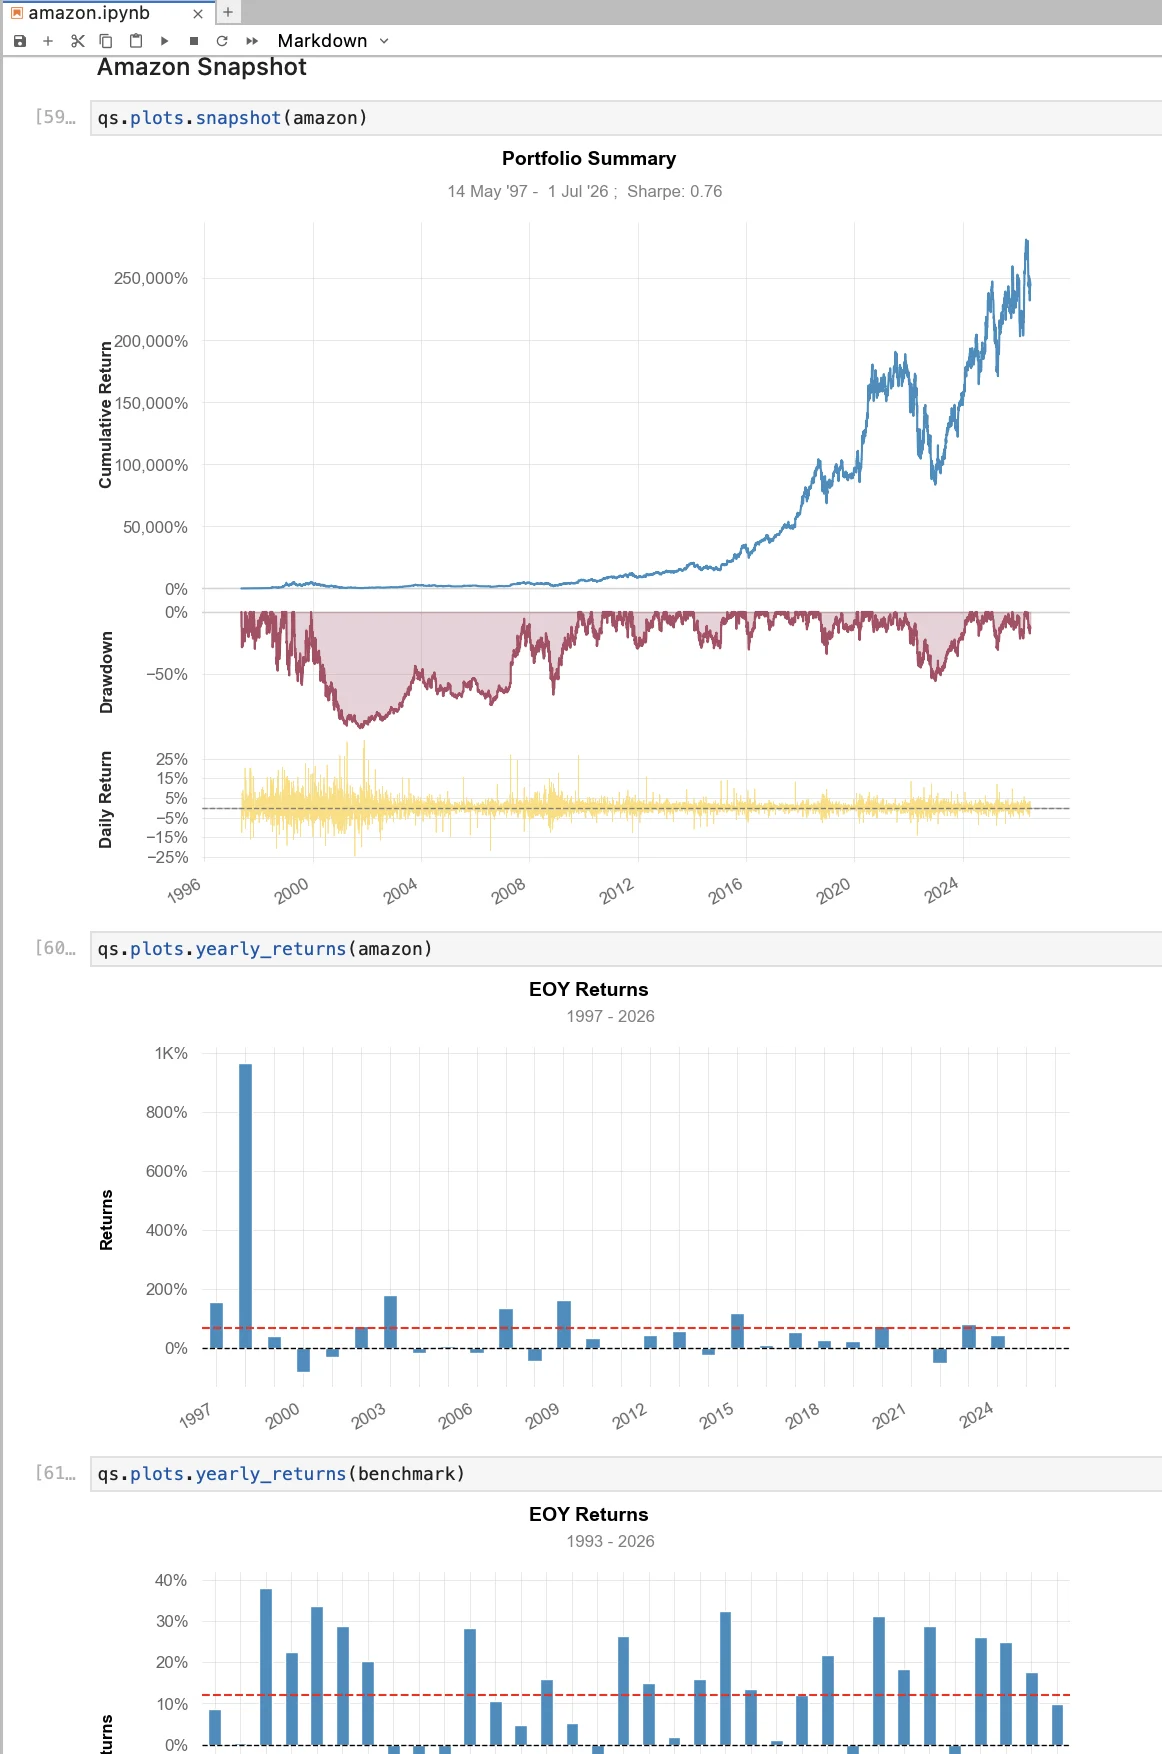 SNAPSHOT — RETURN, DRAWDOWN, DAILY
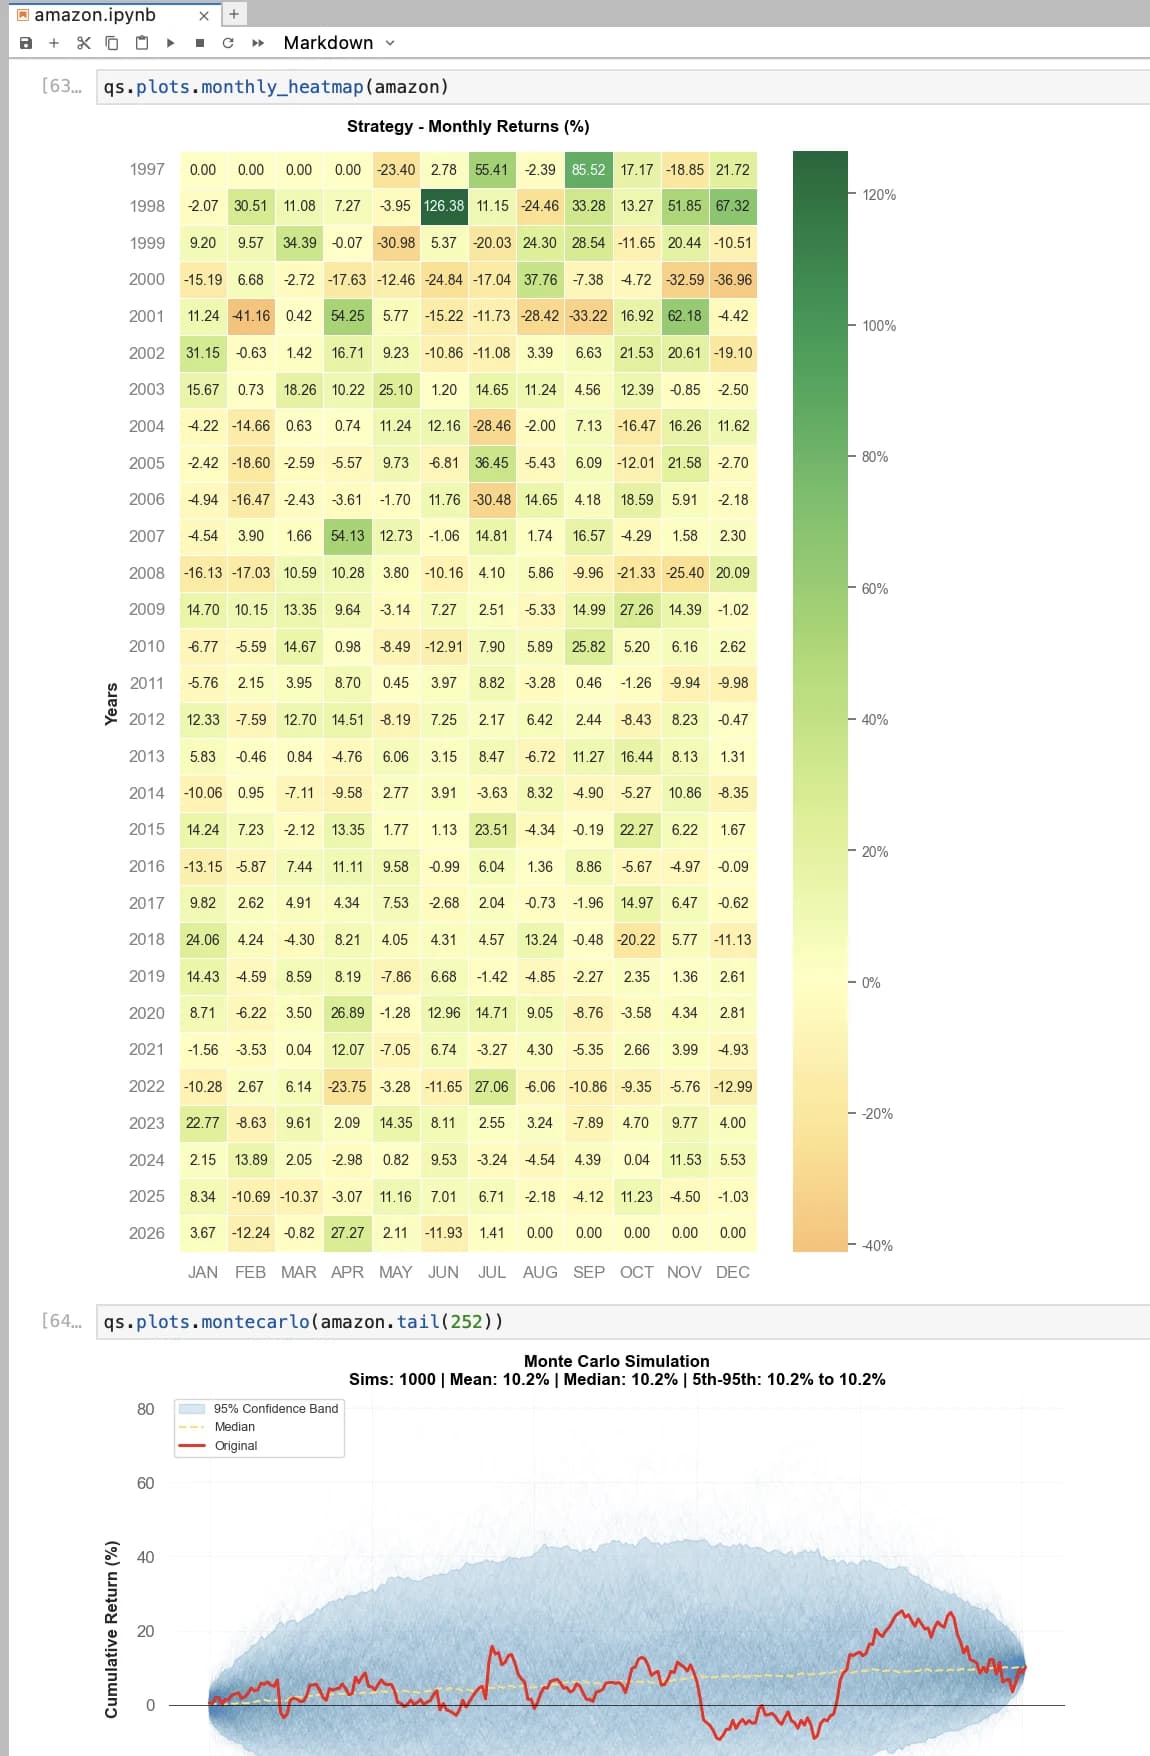 MONTHLY RETURNS, 1997—2026
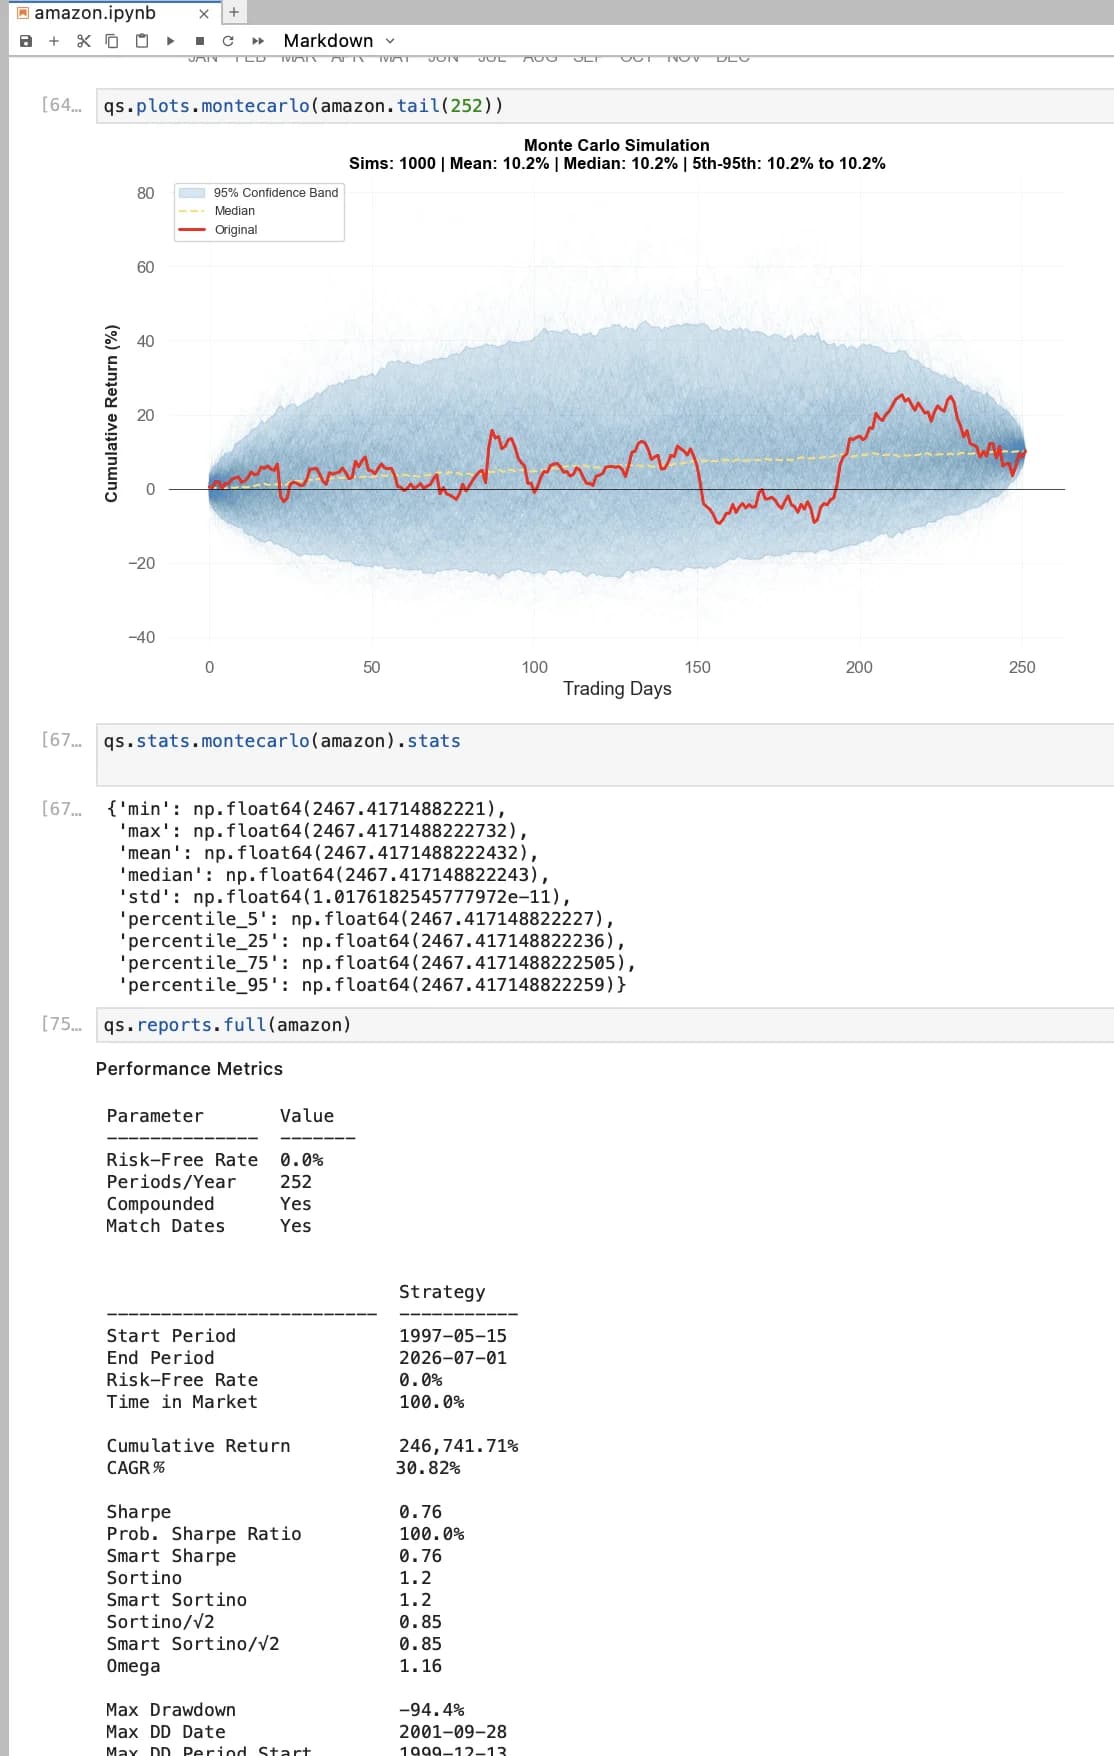 SIMULATION + FULL METRICS TABLE
A quant notebook that treats a 29-year return series as a distribution rather than a headline — running AMZN against the S&P 500 through the risk battery that decides whether a return was earned or just survived.
The problem
Cumulative return is the most quoted and least informative number in investing. It says nothing about the path taken, the volatility endured, or how much of the result was simply market beta. Two assets with identical returns can be completely different propositions once you look underneath.
Approach
- Pull daily returns for AMZN and SPY as a common benchmark, matched on dates.
- Risk-adjusted returns — Sharpe, Sortino and Omega — instead of raw performance.
- Drawdown curves plotted underneath the equity curve, so the pain is visible next to the gain.
- Beta and alpha to separate market exposure from genuine excess return.
- A monthly-return heatmap across every year, and a 1,000-path Monte Carlo on the trailing year to frame the realised path against the distribution it could have taken.
Results
A 30.82% CAGR that most write-ups would stop at — sitting on a −94.4% maximum drawdown, a Sharpe of only 0.76 against the benchmark's 0.65, and a beta of 1.30. The excess return is real (alpha 0.27), but it was paid for in volatility, and the drawdown chart is the honest version of the story.