MNIST DIGIT CNN
A convolutional net built from the layer definitions up in PyTorch — two conv blocks with dropout into a 50-unit head, 21,840 parameters total — trained for ten epochs on a CPU across all 60,000 MNIST digits and scored against the 10,000-image held-out set after every one. 92% after the first epoch, 97.46% by the tenth, with a loss curve that floors at 1.46 for a reason worth explaining.
SOURCE ON GITHUB![Loading MNIST through torchvision: 60,000 training and 10,000 test datapoints with a ToTensor transform, and the training tensor shape printed as torch.Size([60000, 28, 28]).](/_next/image?url=%2Fwork%2Fmnist-digit-cnn%2Fdata.webp&w=3840&q=75) THE DATA — 60,000 TRAIN / 10,000 TEST
THE DATA — 60,000 TRAIN / 10,000 TEST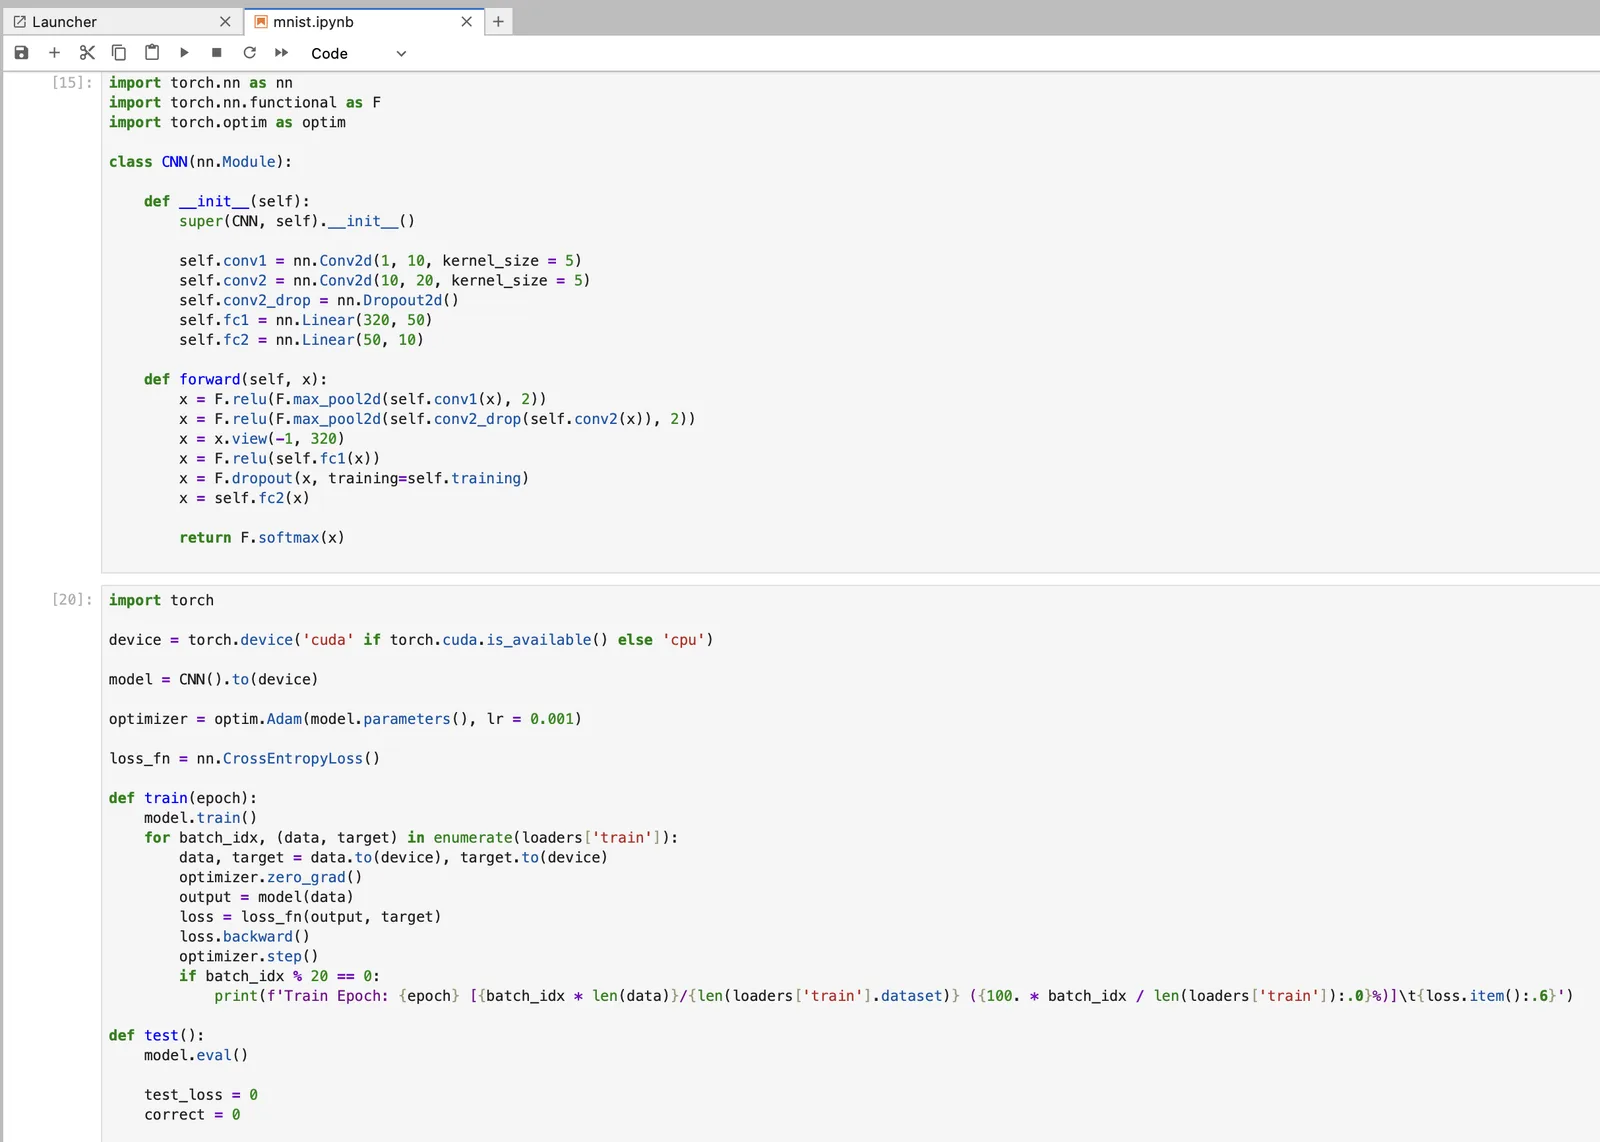 THE NETWORK — TWO CONV BLOCKS, 21,840 PARAMS
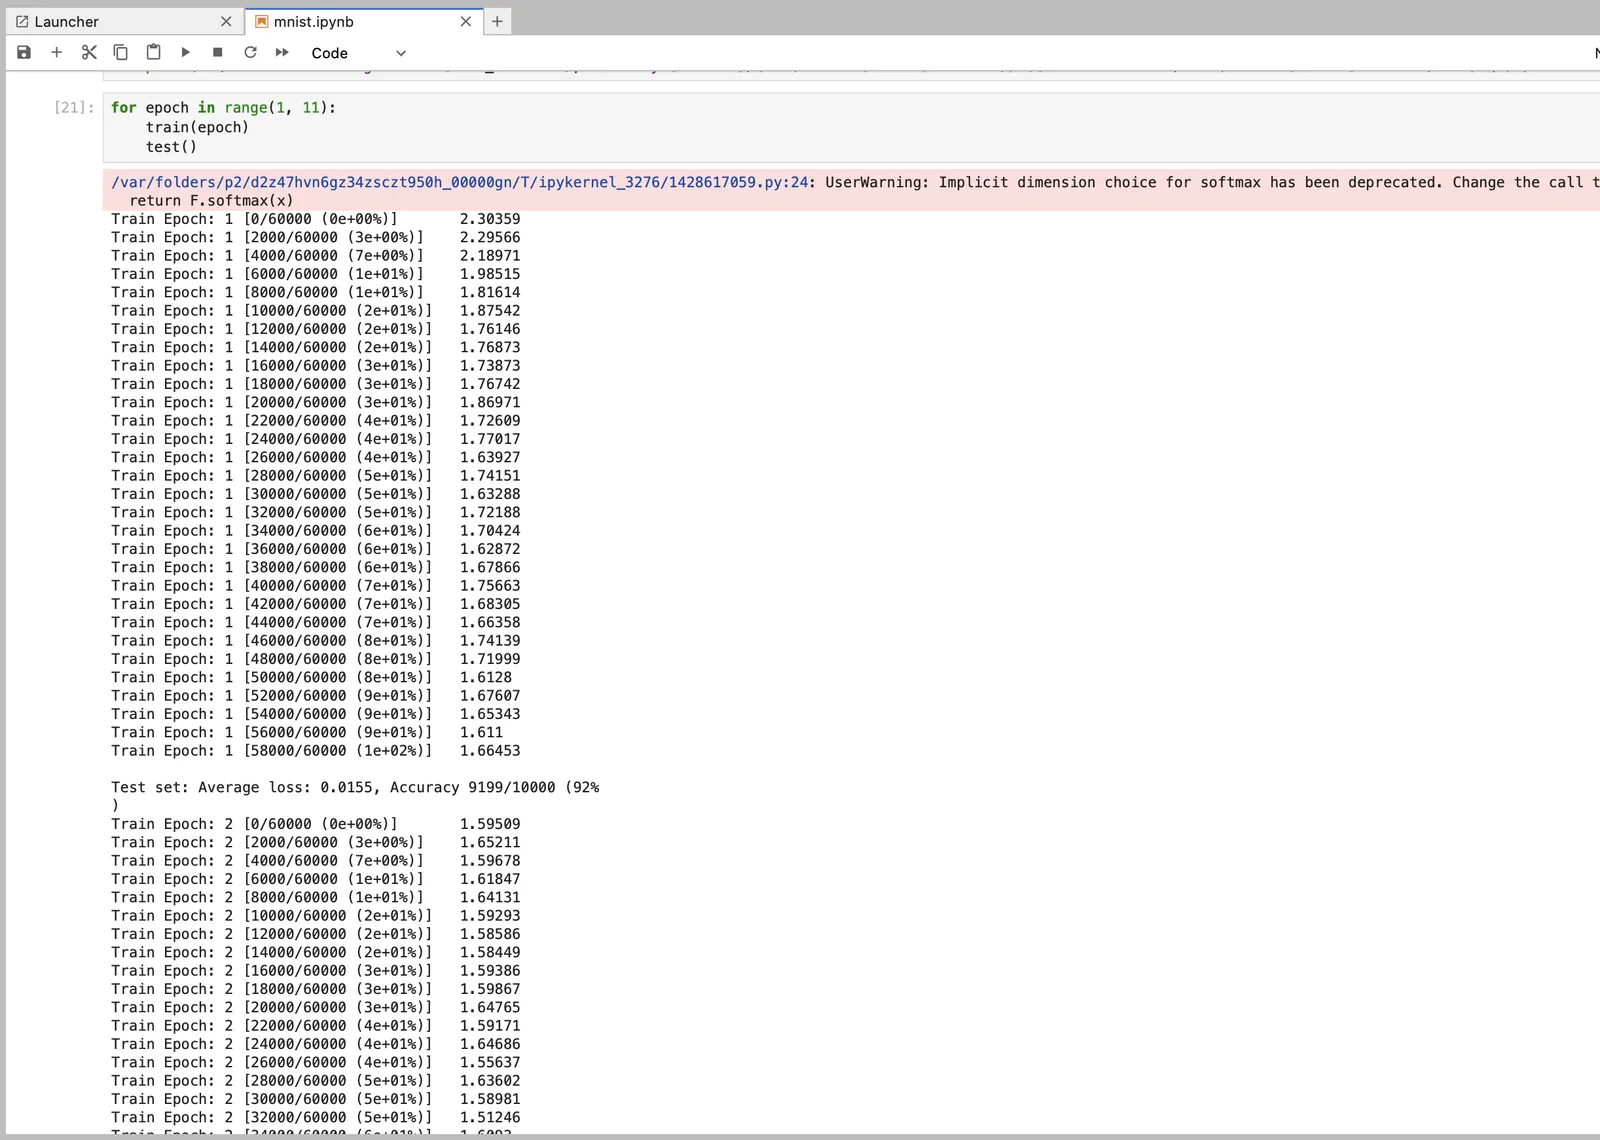 EPOCH 1 — 2.30 → 1.61, 9,199/10,000
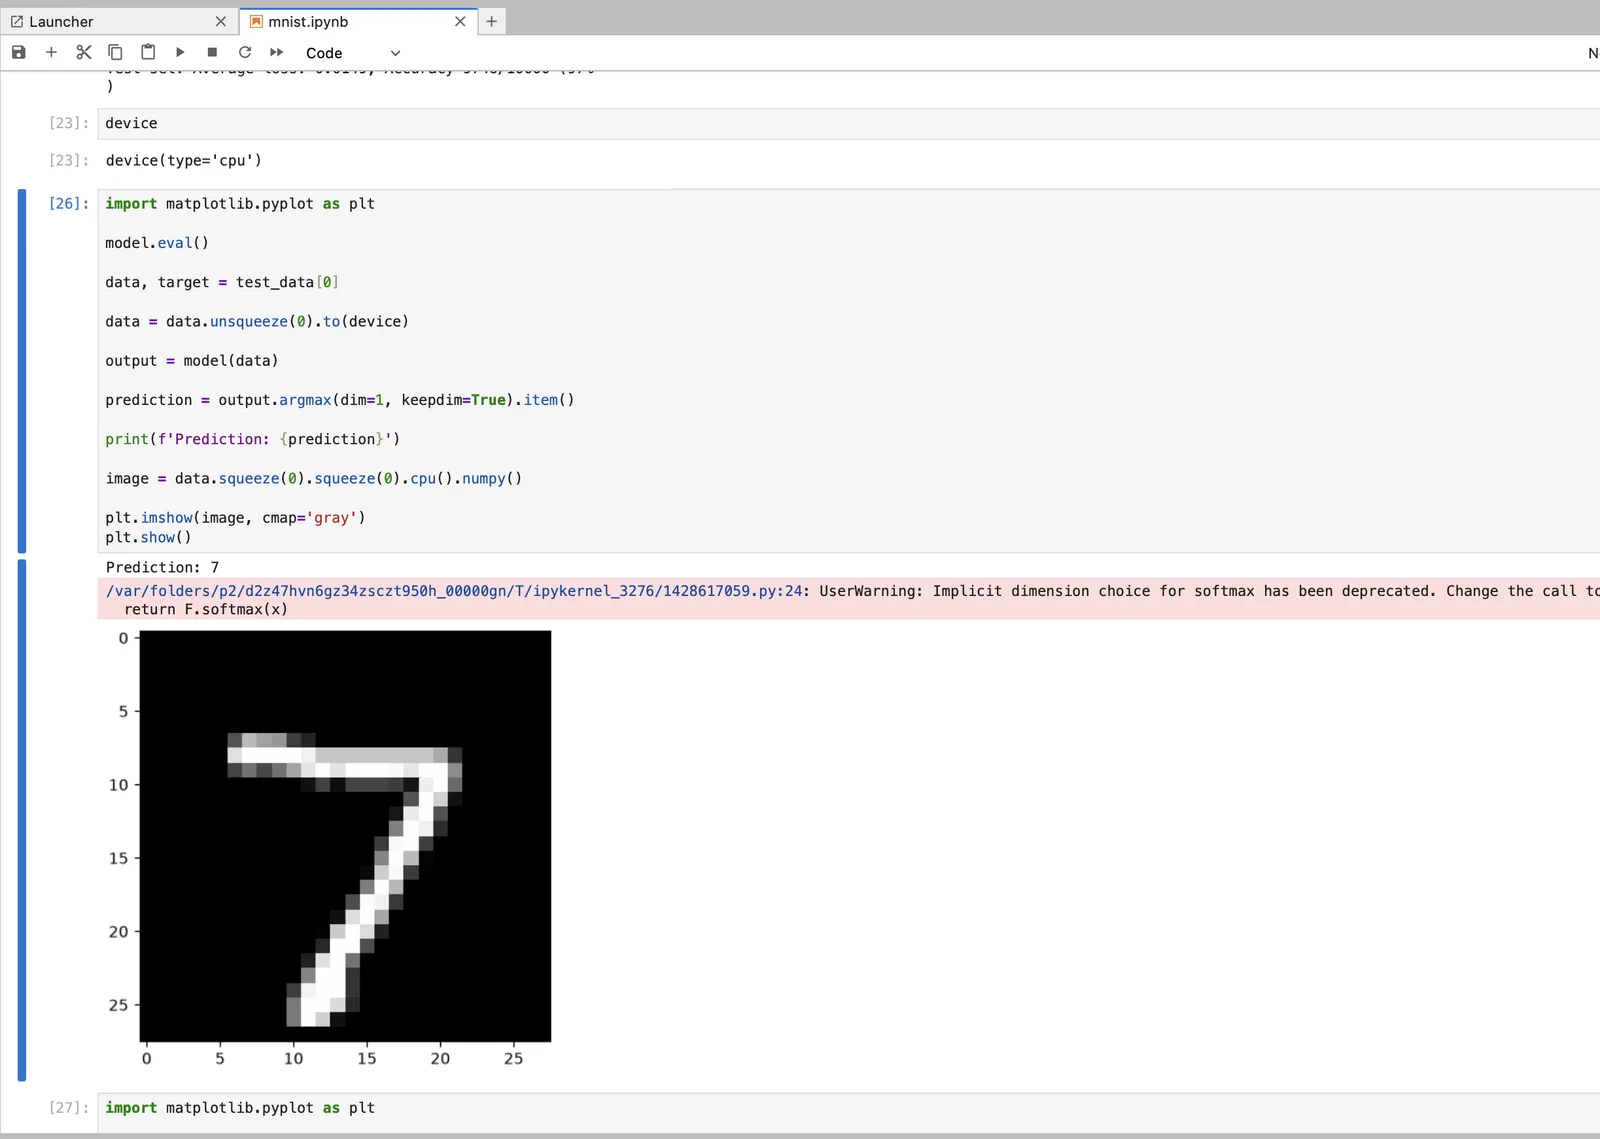 INFERENCE — PREDICTION 7
A convolutional network for handwritten digits, written layer by layer in PyTorch rather than pulled off a shelf — two convolution blocks into a small dense head, 21,840 parameters in total, trained on a laptop CPU over the 60,000-image MNIST training set and scored against the 10,000 images it never saw.
The problem
MNIST is the one dataset where the accuracy number is not the point — everything clears 95%. What it is good for is building the whole loop by hand and being able to account for every number that comes out of it: what each layer does to the tensor shape, what the optimiser is actually being handed, and why the loss curve settles where it does.
Approach
- Two convolution blocks — 1→10 and 10→20 channels on 5×5 kernels, each followed by 2×2 max pooling and ReLU, with Dropout2d on the second to stop the filters co-adapting.
- The 20×4×4 activation map flattened to 320 features into a 50-unit dense layer, dropout again, then 10 outputs — one per digit.
- Adam at lr=0.001 with cross-entropy over batches of 100, shuffled every epoch by the DataLoader.
- A held-out evaluation after every single epoch rather than only at the end, so the accuracy trajectory is visible instead of just its endpoint.
Reading the loss curve
The interesting artefact: the loss falls to about 1.49 and then stops, which looks like a model that has given up. It hasn't. The forward pass returns a softmax and PyTorch's CrossEntropyLoss applies its own log-softmax on top, so the loss is being taken over an already-normalised distribution. Feed it a perfectly confident prediction and the floor is log((e + 9) / e) ≈ 1.461, not 0 — which is exactly where the curve lands. The argmax that produces the prediction is unaffected, since softmax is monotonic; what it does cost is gradient signal, which is why the last few epochs only inch forward.
Results
9,199 of 10,000 correct after the first epoch, climbing to 9,746 — 97.46% — by the tenth, on CPU alone. Inference on individual test images comes back correct and legible: image 0 predicted 7, image 1 predicted 2.